The New Tableau Specialist Exam
Apr 4, 2022
 Lukas Halim
Greetings! Lukas here from learningtableau.com. I asked Klaus if I could do a guest post providing an update to Christine’s terrific series on becoming a Tableau Specialist in 2019. Christine gives a great explanation not only of preparing for the exam but also of how to participate in the Tableau community.
Updates to Tableau’s Certifications
But since Christine’s posts, there have been some changes to the Tableau certifications:
- Tableau retired the Certified Associate and Certified Professional exams
- Tableau launched the Certified Data Analyst exam.
- The Desktop Specialist exam is still offered, with large changes to the exam format and small changes to the exam content.
- Exam administration is now handled by Pearson rather than Loyalist Exam Services
In what follows, I’ll explain what changed and what hasn’t changed for the Tableau Desktop Specialist.
New Format for the Specialist Exam
The format of the Specialist exam has changed significantly. The new Specialist exam does not involve the use of a virtual environment running Tableau Desktop. The exam questions are multiple-choice and multiple responses. You won’t be using Tableau to answer questions about a dataset. In fact, you can’t use Tableau Desktop and you can’t use a web browser to search for documentation during the exam.
But Same Preparation for the Specialist Exam
You might be tempted to think that since you do not use Tableau Desktop during the exam, you can prepare for the exam by watching videos and practice questions. The exam is knowledge-based, so why not just focus on memorizing the knowledge you need to pass?
This would be a major mistake. I’m currently reading a fascinating book called The Extended Mind, and it explains that working with tools (such as Tableau) helps build memory better than just memorizing facts. Consider this passage:
The human brain is not well equipped to remember a mass of abstract information. But it is perfectly tuned to recall details associated with places it knows – and by drawing on the natural mastery of physical space, we can… more than double our effective memory capacity.
Places can include places on a computer screen. So moving pills on the Tableau canvas will build our memory far faster than watching videos or reading documentation. There’s no substitute for hands-on experience. Although you don’t use Tableau during the exam, you still need to use Tableau to prepare for the exam. The exam format has changed, but Christine’s suggestions about exam preparation still apply.
Don’t believe me? Take a look at this conversation, where the poster explains, “missed the passing score by 1 point. I never had the experience with Tableau or used it before. I prepared for the exam by taking a Tableau course on Udemy, went through the Desktop I: Fundamentals (offered by Tableau) and did all the exercises, did three practice exams I found on the Internet.” Don’t try the examich describes someone’s experience taking the exam without having any hands-on experience with Tableau.
The Specialist exam prep guide is updated periodically, but most of the changes are just changes of phrasing. For example, the topic “Create a parameter” has been changed to, “Explain when to use a parameter.”
New Specialist Exam Topics
But there are a few new topics. Here are the ones that have been added since Christine’s series:
- Create a data source that uses multiple connections
- Relationships
- Density Maps
- Export Underlying Data
Let’s go through these!
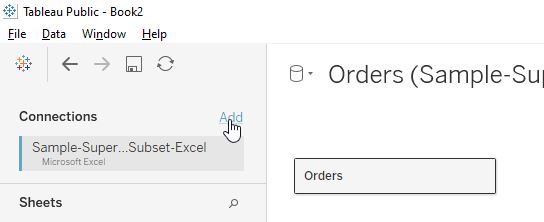
Creating a datasource with Multiple Connections
After connecting to a first data source (I used the Superstore), you can add a second connection by clicking Add:
I used this google sheet with state name and abbreviation. Then I dragged a table from the new connection into the canvas:
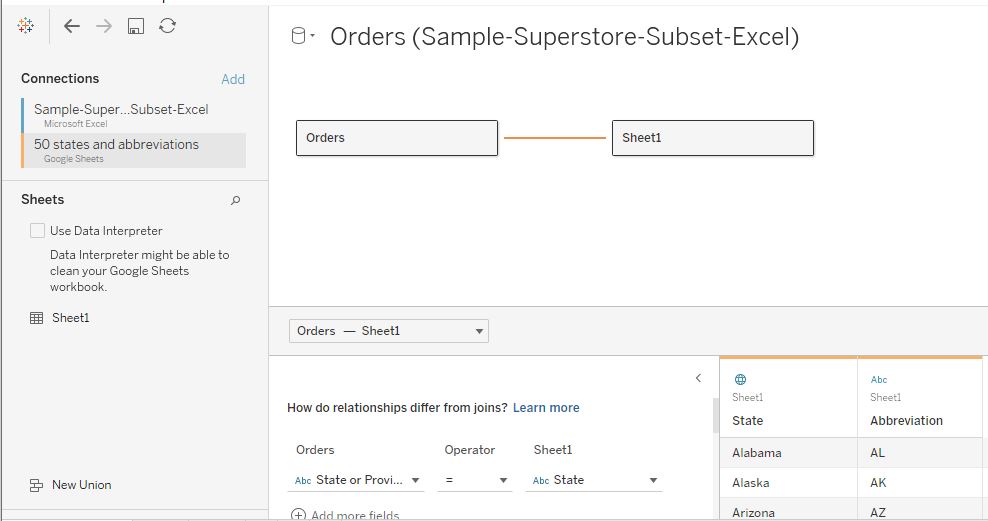
Now my data source has two connections: a first connection to an excel file and a second connection to a google sheet.
Relationships
Tableau now has four ways of combining tables – joins, unions, blends, and relationships. The first three have already been covered by Christine, but the relationships are a new feature as of 2020.
Here’s a relationship I’ve setup:
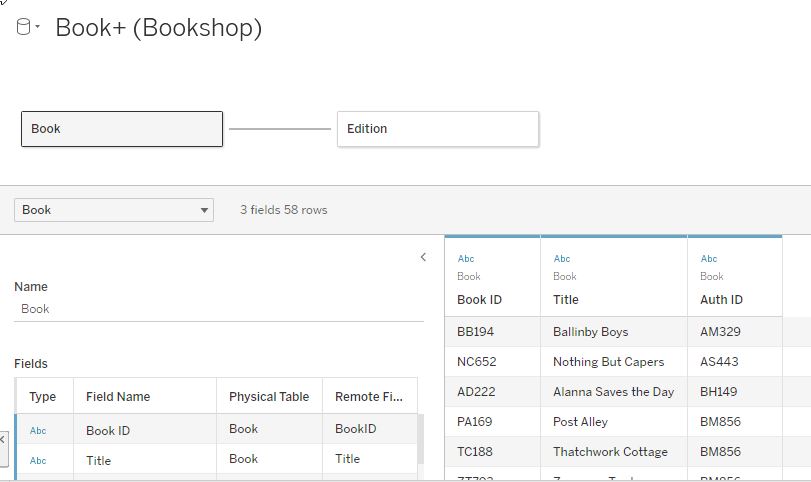
Notice that the Book table is highlighted, and so the preview pane is showing only the Book table. If I selected the Edition table, the preview pane would show the Edition table. This shows one way relationships are different from joins – the tables are kept separate and data is only queried when it is needed in a view.
Notice also that there is no Venn diagram the way you’d see with a join:
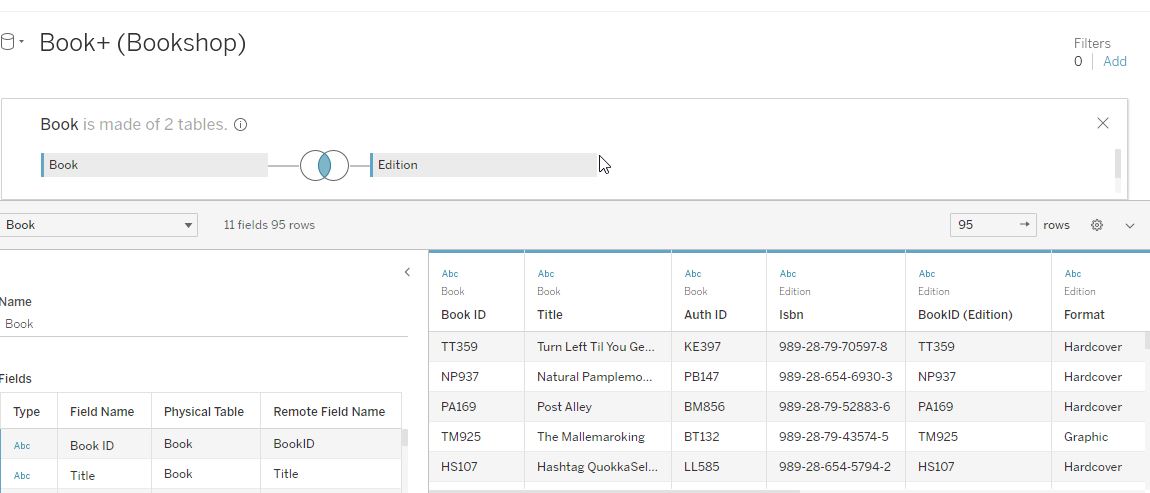
The Venn diagram tells us whether we have a left, right, inner, or outer join. But with relationships, there’s no up-front join type.
Like blends, relationships combine data at different levels of granularity without introducing duplication. But relationships are more flexible in a couple of ways:
- Blends combine two tables, while relationships can with multiple tables
- Blends operate similarly to left joins (“post-aggregation left joins”), where data from the secondary table is included only when there is a match on the linking field. Relationships can operate like left, right, outer, or inner joins.
My advice is to download the Bookshop data set, follow the steps in the “If you build your own data source,” and then try creating visualizations using different bookshop tables. You’ll come out with a good understanding of relationships.
Density Maps
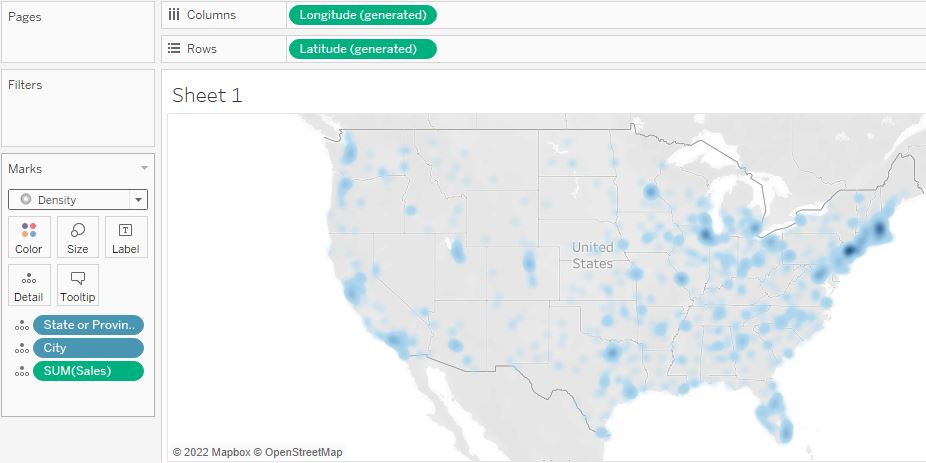
Christine covered geographic mapping previously, but density maps are a new topic. If you know how to create a geographic map, it’s just a quick change to switch to a density map, with darker areas showing larger values:
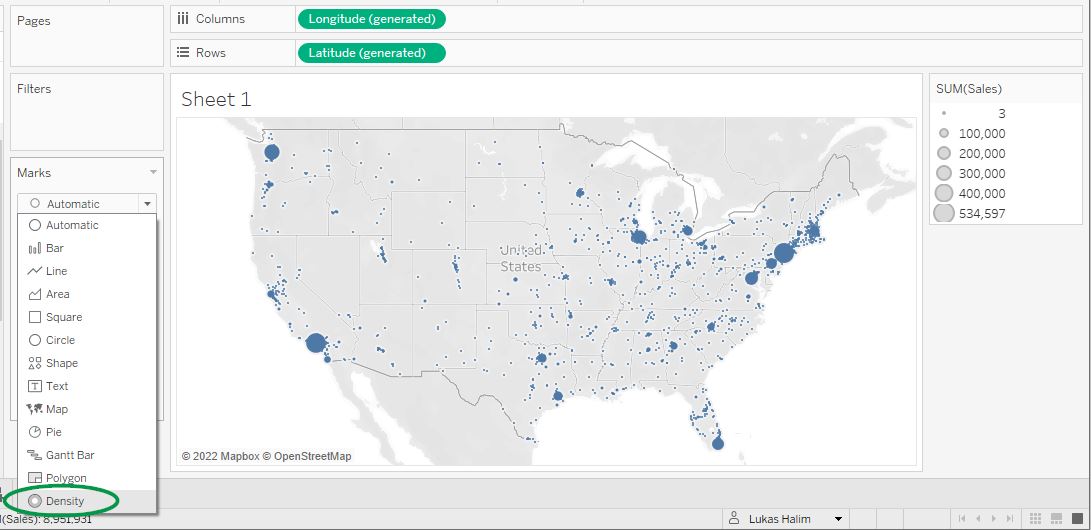
Change the marks type to density and you have a density map:
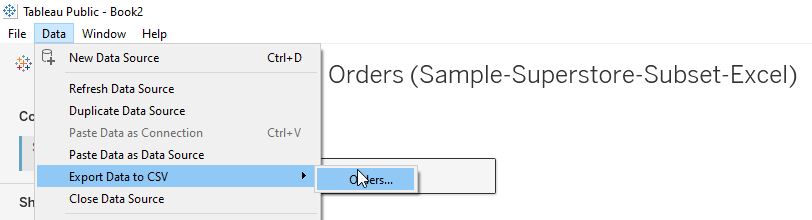
Export Underlying Data
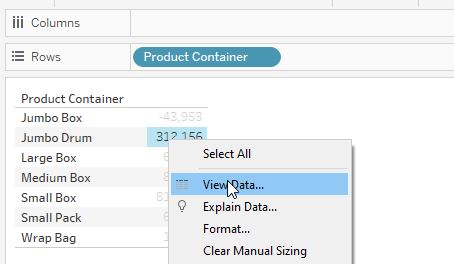
You can export the underlying data from the Data tab on the toolbar:
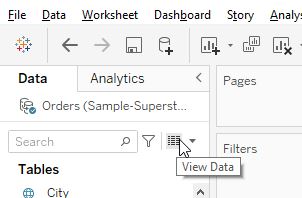
The other export option isn’t available in Tableau Public. But if you’re using Tableau Desktop, you’ll also get an “Export Data” option when you view the underlying data from the data pane or by right-clicking on a mark in the view:
Best Wishes with your Data Viz Journey
Thanks for reading! I hope this post has motivated you to get going with your Tableau certification and to accomplish things with Tableau.
COMMENTS